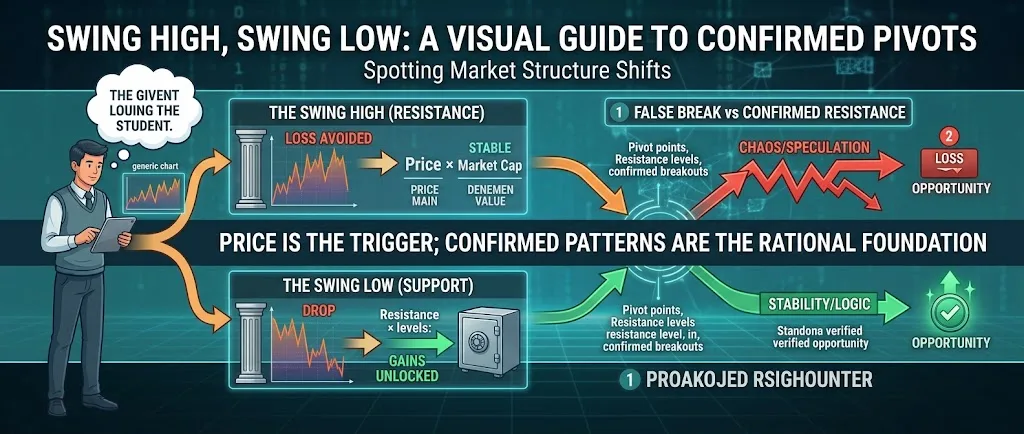
Swing High, Swing Low in Crypto: What They Mean
Prices move in swings, not straight lines. Learn what swing highs and lows are, how they show a market's shape, and why the timeframe changes which swings matter.
Look at any price chart for long enough and a pattern appears. The line never travels straight up or straight down. It zigzags, rising for a while, pulling back, then moving again.
Each of those turns has a name. A swing high, swing low pair marks the points where one move ended and the next began, and in crypto, where prices can move a long way in a short time, these turning points help put a move into context. This guide explains what they are, why they form, and why the timeframe being viewed changes which ones matter.
What is a swing high and a swing low in crypto?
A swing high is a turning point where a rise ended. The price climbed, reached a peak, and then fell back. The peak is the swing high.
A swing low is the opposite. It's a turning point where a fall ended: the price dropped, reached a bottom, and then started rising again. That bottom is the swing low.
Here is an example with made-up prices for an imaginary coin. It rises from $10 to $15, falls back to $12, climbs to $18, then drops to $14.
- $15 and $18 are swing highs, because each rise stopped there.
- $12 is a swing low, because the fall stopped there before the next rise.
- $10 was also a swing low, the starting point of the first rise.
Swing highs and lows can only be confirmed afterwards. While a price is still rising, nobody knows where the peak is. It becomes a swing high only once the price has turned and moved away from it.
Why do prices move in swings instead of straight lines?
Markets are made of many people making separate decisions at different times. Some want to own more of a coin, some want to own less, and their balance keeps shifting.
During a rise, some people decide the price is high enough and take profits. That can slow the rise and turn it into a pullback. During a fall, others see a lower price as worth paying, which can slow the decline and turn it around.
News, wider market mood, and changes in trading volume all add to this back-and-forth. The result is a series of swings rather than a smooth line. Even a coin that ends up much higher over a long period usually gets there through a run of rises and pullbacks.
How do swings show the shape of a market?
Looking at a sequence of swing highs and lows, rather than a single price, shows the overall shape of the movement. This is often called market structure.
| Pattern of swings | What it describes |
|---|---|
| Higher highs and higher lows | An uptrend: each peak and dip is above the last |
| Lower highs and lower lows | A downtrend: each peak and dip is below the last |
| Similar highs and similar lows | A sideways range: price moves back and forth between levels |
In the made-up example above, the swing high moved from $15 to $18, and the swing low moved from $10 to $12. Both were higher than before, which describes an uptrend over that stretch.
This describes what has happened, not what comes next. A run of higher highs can turn into a range or a downtrend at any point, and the structure only changes on the chart after the price has already moved.
Why does the timeframe change which swings matter?
The same chart contains swings of many sizes. Zoom in on a few weeks and dozens of small swings appear. Zoom out to a few years and most of those small swings disappear, leaving only a handful of large ones.
That's why it helps to say which timeframe a swing belongs to. A swing low on a short view might be a minor dip inside a much bigger fall on a long view. A large rise on a long view might be made of many small swings, some of them sharp declines.
A simple way to picture it:
- Short timeframe: many swings, each fairly small. Useful for seeing recent movement.
- Medium timeframe: fewer swings, showing the main moves of recent months.
- Long timeframe: only the largest swings, showing the bigger cycles a coin has gone through.
None of these views is the "true" one. They answer different questions, and looking at more than one gives a fuller picture than any single view.
What can swing levels tell you, and what can't they?
Swing highs and lows are often called swing levels. People use crypto swing levels as reference points: how far has a coin moved since its last swing low, and how does that compare with its earlier moves?
With made-up numbers: if an imaginary coin's last swing low was $10 and it now trades at $13, it has risen 30% from that low. On its own, 30% says little. Compared with that coin's usual swing size, it becomes easier to see whether the current move is small or large for that particular coin.
What swing levels can't do is say where the next turn will be. A move can keep going far longer or further than any earlier swing, and a past swing low offers no promise that the price won't fall through it. Swing levels describe the past and the present, which makes them useful for context and research, not as forecasts.
How does Stratalla measure swings?
Stratalla measures swings over three windows: 20, 50 and 300 days. These roughly match the short, medium and long views described above.
For each window, it shows:
- The swing %: how far the price has moved from the last swing low, or how far it has fallen from the last swing high.
- How many days ago that swing level was set.
- A comparison with the coin's own past: both the swing % and the number of days are set against that coin's average swing size and length in its history.
These measures appear in the crypto screener and in crypto bubbles. The free plan includes the screener for a limited set of coins, along with the bubbles view.
The measures show where a move stands compared with a coin's own earlier moves. They don't say whether a swing is about to end or what happens next. Stratalla doesn't tell anyone what to buy or sell, and it doesn't predict prices. For more on the basics, risk and planning, the crypto academy has lessons covering each.
This article is for education only. It isn't financial advice, and nothing here recommends buying or selling any asset. Crypto prices can fall sharply, and you can lose money. Consider your own situation, and speak to a qualified adviser if you need personal guidance.
Related articles
-
 Market structure
Crypto Trading Volume Explained: Compare It to Its Average
What trading volume measures, why big and small coins can't be compared on raw volume, and why a coin's own recent average is a more useful yardstick.
-
 Market structure
Crypto Market Cap Categories: Large, Mid and Small Caps
What market cap means, how coins are grouped into large, mid and small caps, why size affects price swings and liquidity, and how Stratalla's six tiers work.
-
 Market structure
How Far Is Bitcoin From Its All-Time High?
What an all-time high is, how the percentage below it is calculated, why the same number means different things for different coins, and the arithmetic of recovering losses.