Crypto Trading Volume Explained: Compare It to Its Average
What trading volume measures, why big and small coins can't be compared on raw volume, and why a coin's own recent average is a more useful yardstick.
Trading volume is one of the first numbers shown next to any coin, and one of the easiest to misread. A large number looks important and a small one looks worrying, but on its own, neither says much.
This is crypto trading volume explained in plain terms: what the number measures, why comparing it across coins can mislead, and why a coin's own recent average is a more useful yardstick. It also covers what unusually high or low volume can and can't tell anyone.
Crypto trading volume explained: what does the number measure?
Trading volume is the total value of a coin that changed hands over a set period. Most sites show it for the last 24 hours, measured in US dollars.
Every trade has two sides: one person buys and another sells. Volume counts each trade once. So if someone buys a coin worth $1,000 from someone else, that adds $1,000 to volume, not $2,000.
Volume figures are usually gathered from many exchanges, which are the platforms where coins are traded. Different websites collect data from different sets of exchanges, so the same coin can show slightly different volume from one site to the next.
Why can't raw volume be compared across coins?
Raw volume is the plain dollar figure, before it's compared with anything. The trouble is that coins come in very different sizes.
A coin's market cap is the total value of all its coins in circulation. Large coins usually have many more holders, more exchanges listing them, and far more trading every day. Their raw volume is large simply because they're large.
Here is a made-up example with no real coins:
- Coin A, a large coin, trades $5 billion today. On a normal day it trades about $8 billion.
- Coin B, a small coin, trades $20 million today. On a normal day it trades about $5 million.
On raw numbers, Coin A looks 250 times busier. But compared with its own normal level, Coin A is having a quiet day, while Coin B is trading about four times its usual amount. The raw figures mostly show how big each coin is. They say very little about whether anything unusual is happening.
Why compare a coin with its own average?
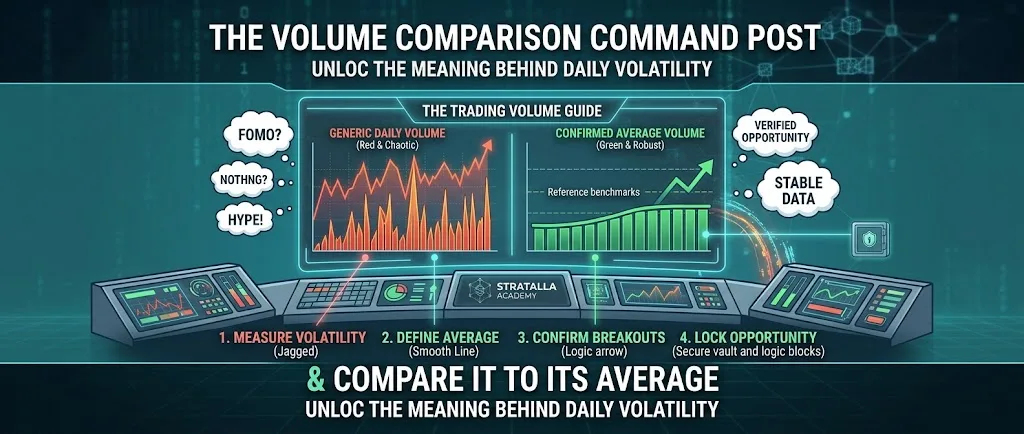
An average shows a coin's typical level of trading over a recent stretch of time. Comparing today's volume with that average answers a more useful question: is this coin busier or quieter than usual for itself?
This puts every coin on the same footing. A large coin and a small coin can both be "twice as busy as normal", even if their raw volumes are worlds apart.
The word "recent" matters. Coins change over time as they grow, shrink, or get listed on more exchanges. An average from long ago may describe a very different coin, while a recent one reflects what normal looks like now.
Some averages are also smoothed. That means they move gradually, so one strange day doesn't throw the whole picture off. The result is a steadier baseline to compare each new day against.
What does unusually high or low volume tell you?
Volume shows activity. It describes how much trading took place, and nothing more. That's useful, but it's easy to read too much into it.
What can high volume mean?
Volume well above a coin's own average means more trading than usual. That often comes with attention of some kind: a news story, a new exchange listing, a scheduled release of new coins (often called a token unlock), a large price move, or a busy day across the whole market.
Sometimes there is no clear reason at all. One large holder moving coins between platforms can lift volume on its own.
What can low volume mean?
Volume well below the average means a quieter period than usual. Quiet stretches are a normal part of how markets work, and low volume on its own doesn't mean a coin is failing.
When trading is thin, though, fewer orders are waiting on each side. In those conditions, a single large trade can move the price more than it would on a busy day. Low volume is worth knowing about for that reason.
What can't volume tell you?
Because every trade has a buyer and a seller, volume can't show direction. A busy day can come with a rising price, a falling price, or a price that barely moves. Volume doesn't show who was trading, why they traded, or what happens next.
There's one more caution. Some trading is wash trading, where the same party trades with itself to make a coin look more active than it is. This is one more reason not to treat a volume spike as proof of real interest.
How does Stratalla show trading volume?
Stratalla compares each coin's daily volume with a smoothed recent average of that same coin's volume. It then groups the result into four volume categories:
| Category | Daily volume compared with the coin's own average |
|---|---|
| Low | Under about 0.75 times |
| Medium | About 0.75 to 1.5 times |
| High | 1.5 to 2.5 times |
| Significant | 2.5 times or more |
It also shows a volume ratio, a single number describing how the day's volume compares with the coin's own recent average.
Both appear in the crypto screener, next to swing measures, market cap tier, and distance from the all-time high. They also appear in the Crypto Bubbles view, which can colour and size coins by volume ratio or volume category. The free plan includes the screener for a limited set of coins, as well as the bubbles view.
Stratalla doesn't tell anyone what to buy or sell, and it doesn't predict prices. The volume categories describe how active a coin has been compared with its own normal level, and nothing more.
What questions help when volume changes?
Learning how to read crypto volume is mostly about asking the right follow-up questions, rather than reacting to the number itself. A short checklist helps:
- Is this unusual for this coin, or only large compared with other coins?
- Is it a single day, or has activity been above or below average for several days?
- Is the whole market busier or quieter, or is it just this coin?
- Did the price also move, and how big was that move compared with the coin's own history?
- Is there known news, a listing, or a token unlock that might explain it?
None of these questions leads to a clear signal, and they aren't meant to. They put volume in context, so it becomes one piece of information among several instead of a reason to act on its own.
For a wider grounding in risk and planning, the lessons in the crypto academy cover the basics that sit underneath numbers like this.
This article is for education only. It isn't financial advice, and nothing here recommends buying or selling any asset. Crypto prices can fall sharply, and you can lose money. Consider your own situation, and speak to a qualified adviser if you need personal guidance.
Related articles
-
 Market structure
Swing High, Swing Low in Crypto: What They Mean
Prices move in swings, not straight lines. Learn what swing highs and lows are, how they show a market's shape, and why the timeframe changes which swings matter.
-
 Market structure
Crypto Market Cap Categories: Large, Mid and Small Caps
What market cap means, how coins are grouped into large, mid and small caps, why size affects price swings and liquidity, and how Stratalla's six tiers work.
-
 Market structure
How Far Is Bitcoin From Its All-Time High?
What an all-time high is, how the percentage below it is calculated, why the same number means different things for different coins, and the arithmetic of recovering losses.