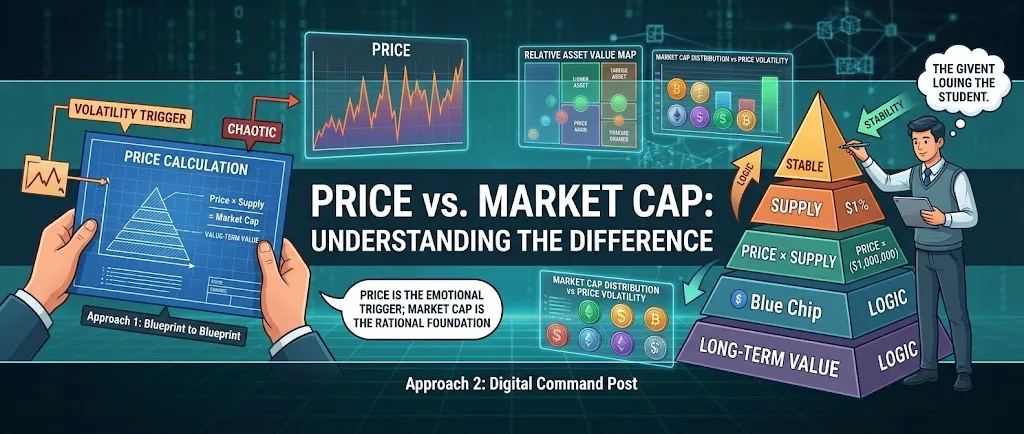
Price vs Market Cap in Crypto: Why It Matters
Why a low price per coin doesn't make a coin cheap. Learn how market cap, circulating supply and fully diluted value fit together, with made-up examples.
Many people new to crypto look at the price of a single coin and decide whether it seems cheap or expensive. A coin that costs a fraction of a cent can feel like a bargain, while one that costs hundreds of dollars can feel out of reach. That instinct is understandable, but it often leads to the wrong conclusion.
This guide explains price vs market cap in crypto: what each number tells you, why the price alone says little about a coin's size, and how supply can quietly change the picture over time.
Why doesn't a low price make a coin cheap?
The price of one coin only tells you what a single unit costs. It says nothing about how many units exist. A project can split its value into a few coins or into billions of coins, and the price per coin will look completely different even if the whole project is worth the same.
The habit of judging a coin by its unit price has a name: unit bias. People like owning whole units, so owning a million of something feels more satisfying than owning a small slice of one. That feeling is about psychology, not value.
A useful comparison is a pizza. Cutting it into eight slices or eighty slices doesn't change how much pizza there is. A smaller slice isn't a better deal just because it's smaller.
Price vs market cap in crypto: what's the difference?
Market cap, short for market capitalization, is the total value of all the coins currently in circulation. It's calculated with a simple formula:
- Market cap = price per coin × circulating supply
Circulating supply means the number of coins that exist and can be traded right now. When people compare market cap vs price, market cap is the number that describes the size of a project. Price only describes the size of one piece.
Here is an example with two made-up coins:
| Made-up coin | Price per coin | Circulating supply | Market cap |
|---|---|---|---|
| Coin A | $0.01 | 100 billion | $1 billion |
| Coin B | $500 | 2 million | $1 billion |
Coin A looks far cheaper on a price list. Yet both coins have exactly the same market cap. The market values them the same; Coin A has simply been cut into many more pieces.
What does "it could reach $1" actually imply?
A common thought among beginners is that a coin priced at a fraction of a cent "only" has to reach $1 to multiply in value many times over. The arithmetic behind that idea is worth checking, because supply changes everything.
Take a made-up coin, Coin C. It has a price of $0.01 and a circulating supply of 500 billion coins. Its market cap today is:
- $0.01 × 500 billion = $5 billion
Now imagine the price at $1, with the same supply:
- $1 × 500 billion = $500 billion
For Coin C to reach $1, the entire project would need to be valued at 100 times its current size. It means the whole market would have to place an enormous amount of new value on that one project.
So the useful question isn't "could the price reach a round number?" It's "what total value would that price imply, given how many coins exist?" Asking it turns a feeling into a calculation, and the answer is often very different from what the low price suggests. None of this says anything about what any coin will do. It only shows what a given price would mean.
How do circulating, total and max supply differ?
Supply comes in three forms, and each answers a different question:
- Circulating supply: coins that exist and can be traded now. This is the number used for market cap.
- Total supply: all coins created so far, including ones that are locked, reserved or not yet released to the market.
- Max supply: the largest number of coins that can ever exist, according to the project's rules. Some coins have no max supply at all, so new coins can keep being created.
The gap between these numbers matters. If circulating supply is much smaller than total or max supply, many more coins may enter the market later.
New coins usually arrive in two ways. Unlocks release coins that were held back, often for the team, early backers or a project treasury. Emissions are new coins created over time, for example as rewards for people who help run the network.
Supply growth changes the arithmetic. If a project's total value stayed the same while its circulating supply doubled, each coin would represent half as much of that value. The study of how a coin's supply is designed and released is often called tokenomics, and it's worth understanding before forming any view on a project.
What is fully diluted value?
Fully diluted value, often shortened to FDV, answers a simple question: what would the market cap be if every coin that can ever exist were already in circulation, at today's price?
- FDV = price per coin × max supply (or total supply, if there is no max supply)
Here is a made-up example. Coin D has a price of $2, a circulating supply of 100 million and a max supply of 1 billion.
| Measure | Calculation | Result |
|---|---|---|
| Market cap | $2 × 100 million | $200 million |
| Fully diluted value | $2 × 1 billion | $2 billion |
Coin D's FDV is ten times its market cap. That tells you only a tenth of its eventual supply is in circulation today. A large gap between market cap and FDV doesn't say whether a coin is good or bad, but it's a reason to look closely at when and how the remaining coins will be released.
Where can you see these numbers on Stratalla?
Stratalla shows market cap and supply data so you can look beyond the price per coin. Each coin's page and the crypto screener show the coin's market cap and its market cap tier, from Titans to Wild Cards. The tier is based on how the coin ranks by market cap among the coins Stratalla tracks.
Coin pages also show circulating supply, total supply and max supply, with unlimited supply shown as ∞. They show what percentage of the max supply is already in circulation, which is a quick way to see how much future supply may still come. The Bitcoin page is one example of a coin page with these figures. The free plan includes the screener for a limited set of coins.
Stratalla doesn't tell anyone what to buy or sell, and it doesn't predict prices. These figures are there to help you understand what you're looking at. If you're just starting out, crypto investing 101 covers the wider basics.
In short, a coin's price tells you the cost of one piece. Market cap, supply and FDV tell you how big the whole thing is.
This article is for education only. It isn't financial advice, and nothing here recommends buying or selling any asset. Crypto prices can fall sharply, and you can lose money. Consider your own situation, and speak to a qualified adviser if you need personal guidance.
Related articles
-
 Crypto basics
Best Crypto Course for Beginners: An 8-Point Checklist
Crypto courses range from honest teaching to sales funnels. An 8-point checklist for judging the best crypto course for beginners, plus the red flags to watch for.
-
 Crypto basics
How to Learn Crypto Before You Invest
Most crypto losses start with buying something you don't understand. Why learning comes first, the mistakes it prevents, what to study, and how to tell when you know enough.
-
 Crypto basics
Crypto Investing 101: A Beginner's Guide Before You Buy
A crypto beginners guide: what crypto is, how to judge a coin, the risks unique to crypto, and a checklist to think through before a first purchase.